Citrix Monitor Service API 7.15 LTSR
The Monitor Service API is built on top of SQL Server databases using Windows Communication Foundation (WCF) Data Services that are populated during processing and consolidation.
The Monitor Service API uses the Open Data (OData) protocol, which is a Web protocol for querying and updating data, built upon Web technologies such as HTTP.
The Monitor Service API is a REST-based API that can be accessed using an OData consumer. OData consumers are applications that consume data exposed using the OData protocol.
You can use the API to:
-
Analyze historical trends for future planning
-
Perform detailed troubleshooting of connection and machine failures
-
Extract information for feeding into other tools and processes; for example, using Microsoft Excel’s PowerPivot tables to display the data in different ways
-
Build a custom user interface on top of the data that the API provides
Data Available using the API
The following types of data are available through the Monitor Service API:
-
Data relating to connection failures
-
Machines in a failure state
-
Session usage
-
Logon duration
-
Load balancing data
-
Hotfixes applied to a machine
-
Hosted application usage
For the details of the Monitor Service schema, please refer to: Monitor Service Schema.
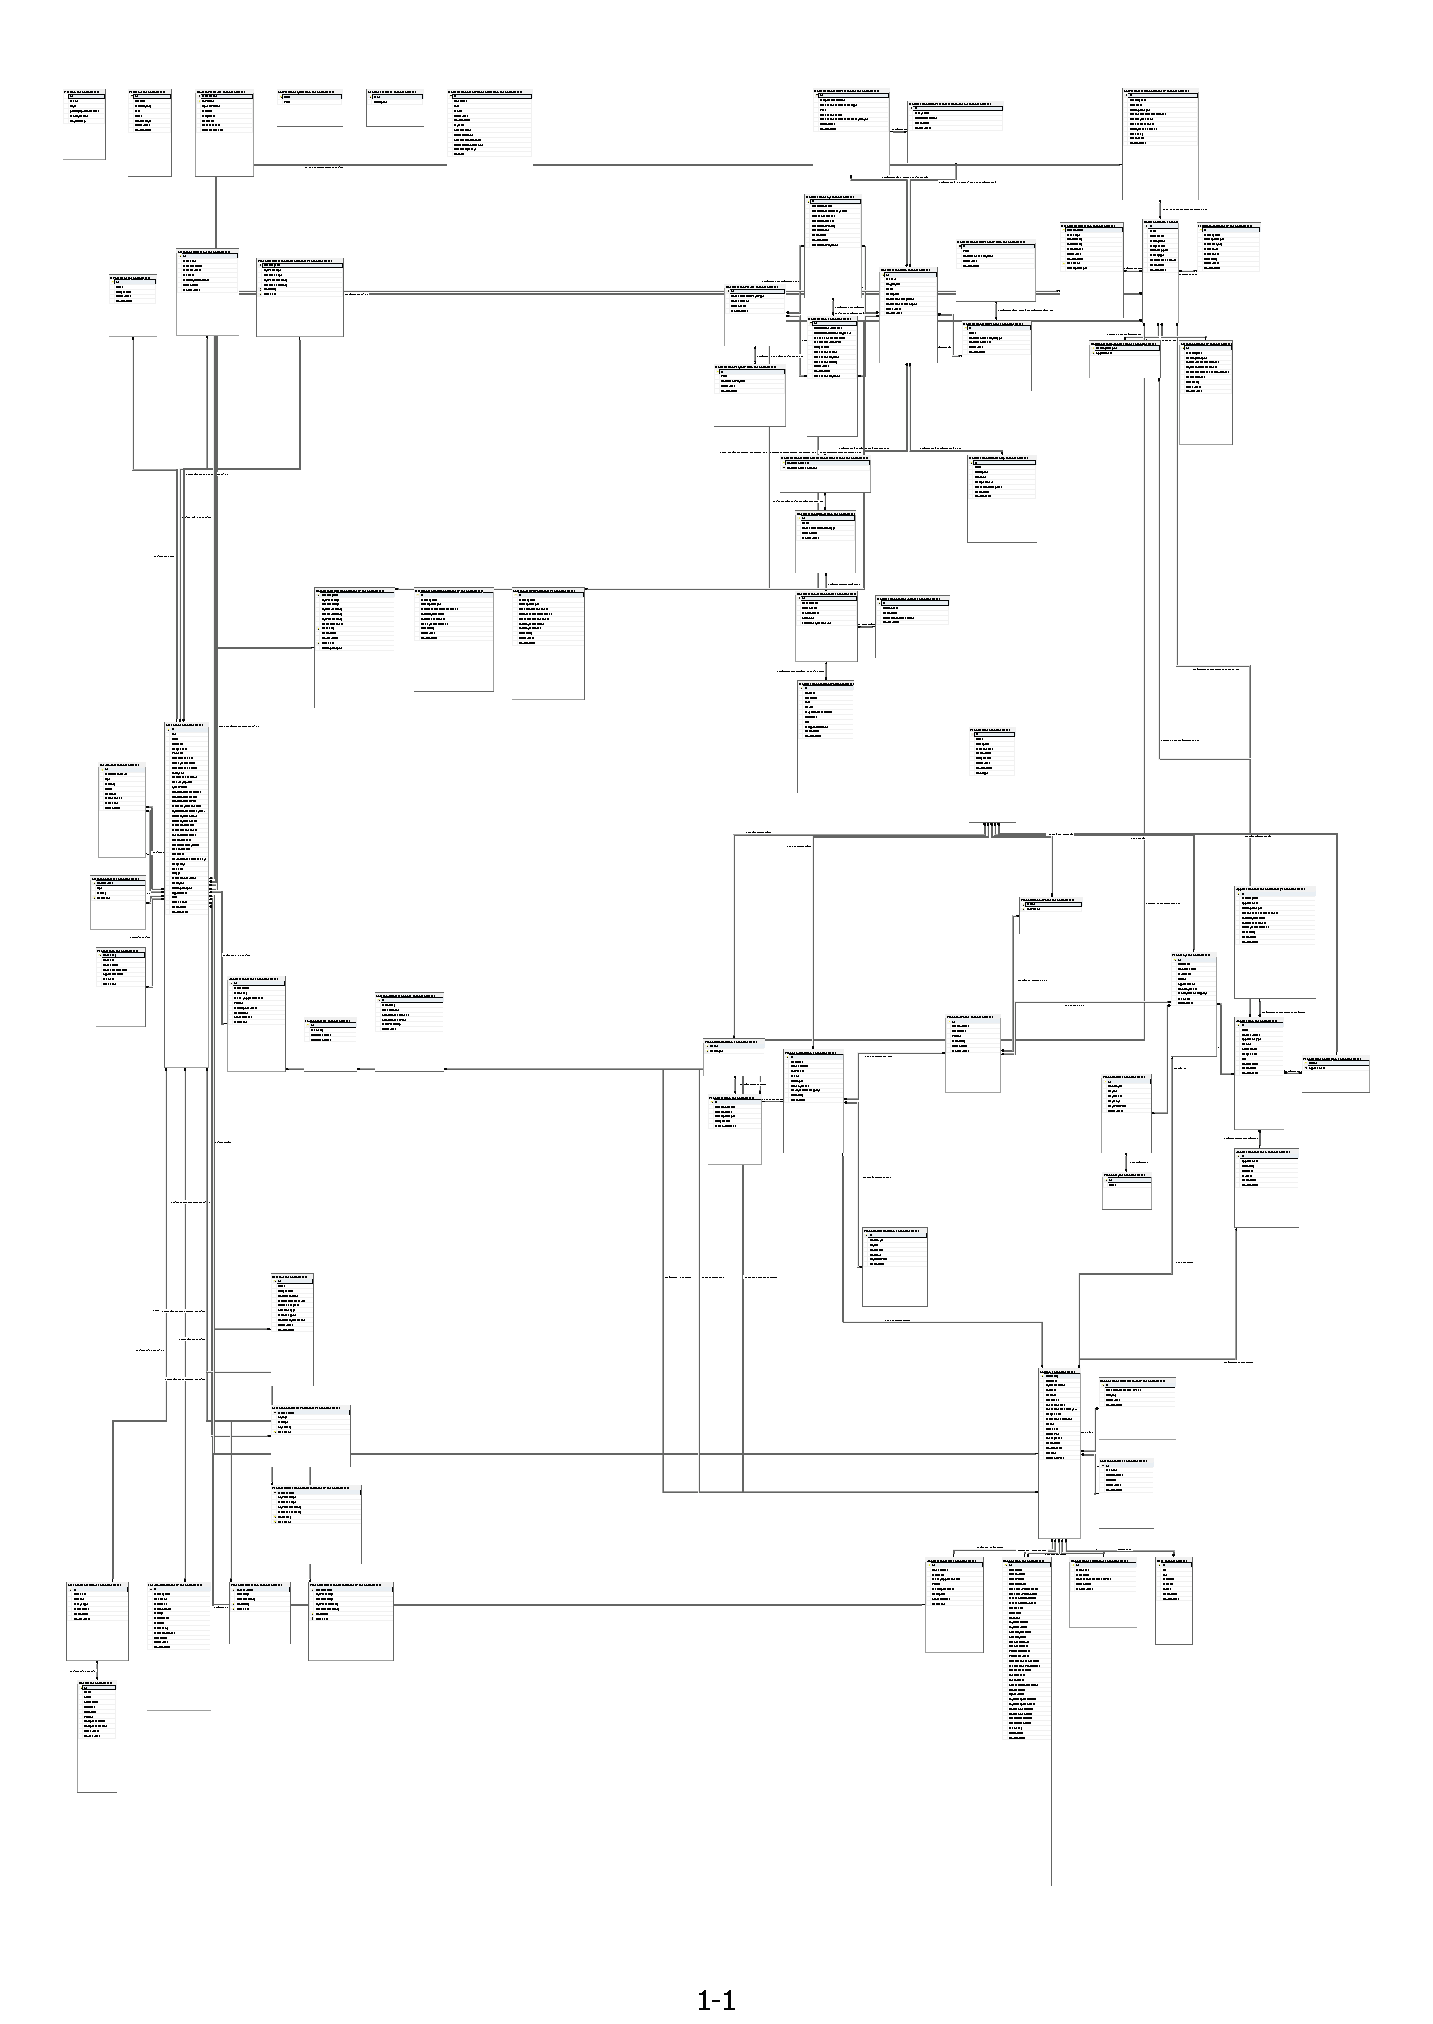
To determine the values returned by the Monitor Service OData API, see: Citrix Monitor Data Model
How to Access the Monitor Service Data
Citrix recommends that you don’t use the Methods endpoints of the Monitor Service API directly. They contain operations used by Director to retrieve data requiring complex grouping and high performance standards. The results are available on the Dashboard and Trends pages, and in the export reports in Director.” In the section “How to access the Monitor Service data
Data Access Privilege
To use the Monitor Service OData API, you must be a XenApp or XenDesktop administrator. To call the API, you require read-only privileges; however, the data returned is determined by XenApp or XenDesktop administrator roles and permissions.
For example, Delivery Group Administrators can call the Monitor Service API but the data they can obtain is controlled by Delivery Group access set up using Citrix Studio.
For more information about XenApp or XenDesktop administrator roles and permissions, see Delegated Administration.
Data Access Security
If you choose to use TLS, you must configure TLS on all Delivery Controllers in the site; you cannot use a mixture of TLS and non-TLS.
To secure Monitor Service endpoints using TLS, you must perform the following configuration. Some steps need to be done only once per site, others must be run from every machine hosting the Monitor Service in the site. The steps are described below.
Part 1: Certificate registration with the system
-
Create a certificate using a trusted certificate manager. The certificate must be associated with the port on the machine that you wish to use for OData TLS.
-
Configure the Monitor Service to use this port for TLS communication. The steps depend on your environment and how this works with certificates. The following example shows how to configure port 449:
-
Associate the certificate with a port:
         netsh http add sslcert ipport=0.0.0.0:449
         certhash=97bb629e50d556c80528f4991721ad4f28fb74e9

         appid='{00000000-0000-0000-0000-000000000000}'
Tip: In a PowerShell command window, ensure you put single quotes around the GUID in the appID, as shown above, or the command will not work. Note that a line break has been added to this example for readability only.
Part 2: Modify the Monitor Service configuration settings
1.From any Delivery Controller in the site, run the following PowerShell commands once. This removes the Monitor Service registration with the Configuration Service.
asnp citrix.\*

 \$serviceGroup = get-configregisteredserviceinstance -servicetype
 Monitor | Select -First 1 ServiceGroupUid

 remove-configserviceGroup -ServiceGroupUid
 \$serviceGroup.ServiceGroupUid
<!--NeedCopy-->
2.Do the following on all Controllers in the site:
- Using a cmd prompt, locate the installed Citrix Monitor directory (typically in C:\Program Files\Citrix\Monitor\Service). Within that directory run:
Citrix.Monitor.Exe -CONFIGUREFIREWALL -ODataPort 449 -RequireODataSsl
<!--NeedCopy-->
- Run the following PowerShell commands:
asnp citrix.\* (if not already run within this window)

get-MonitorServiceInstance | register-ConfigServiceInstance

Get-ConfigRegisteredServiceInstance -ServiceType Config |
Reset-MonitorServiceGroupMembership

<!--NeedCopy-->
Data Access Protocol
The Monitor Service API is a REST-based API that can be accessed using an OData consumer. OData consumers are applications that consume data exposed using the OData protocol. OData consumers vary in sophistication from simple web browsers to custom applications that can take advantage of all the features of the OData Protocol.
Every part of the Monitor Service data model is accessible and can be filtered on the URL. OData provides a query language in the URL format you can use to retrieve entries from a service.
The query is processed on the server side and can be filtered further using the OData protocol on the client side.
The data modeled falls into three categories: aggregate data (the summary tables), current state of objects (machines, sessions, etc.), and log data, which is really historical events (connections, for example).
Note: Enums are not supported in the OData protocol; integers are used in their place. To determine the values returned by the Monitor Service OData API, see Monitor Service Data Model .
What is OData Protocol?
OData (Open Data Protocol) is an OASIS standard that defines a set of best practices for building and consuming RESTful APIs. OData helps you focus on your business logic while building RESTful APIs without having to worry about the various approaches to define request and response headers, status codes, HTTP methods, URL conventions, media types, payload formats, query options, etc.
OData also provides guidance for tracking changes, defining functions/actions for reusable procedures, and sending asynchronous/batch requests.
OData RESTful APIs are easy to consume. The OData metadata, a machine-readable description of the data model of the APIs, enables the creation of powerful generic client proxies and tools.
OData Consumers: http://www.odata.org/ecosystem/#consumers
Client Libraries: http://www.odata.org/libraries/
Basic Tutorial: http://www.odata.org/getting-started/basic-tutorial/
What is WCF?
As OData Provider, Citrix Monitor Service API is implemented by WCF.
Windows Communication Foundation (WCF) is Microsoft’s unified programming model for building service-oriented applications.
For more detail about WCF, see Windows Communication Foundation
Examples
The following examples show how to export Monitor Service data using the OData API. This topic also provides a list of URLs for available data sets.
Example 1 - Raw XML
-
Place the URL for each data set into a web browser that is running with the appropriate administrative permissions for the XenApp or XenDesktop Site. Citrix recommends using the Chrome browser with the Advanced Rest Client add-in.
-
View the source.
Example 2 - PowerPivot with Excel
-
Install Microsoft Excel.
-
Follow the instructions here to install PowerPivot (depending on whether or not you are using 2010 or 2013): [https://support.office.com/en-us/article/Start-Power-Pivot-in-Microsoft-Excel-2013-add-in-a891a66d-36e3-43fc-81e8-fc4798f39ea8.]
-
Open Excel (running with the appropriate administrative permissions for the XenApp or XenDesktop Site).
Using Excel 2010
-
Click the PowerPivot tab.
-
Click PowerPivot Window.
-
Click From Data Feeds in the ribbon.
-
Choose a Friendly Connection Name (for example: XenDesktop Monitoring Data) and enter the data feed url: http://{dc-host}/Citrix/Monitor/OData/v1/Data (or https: if you are using SSL).
-
Click Next.
-
Select the tables you want to import into Excel and click Finish. The data is retrieved.
Using Excel 2013
-
Click the Data tab.
-
Choose From Other Sources > From OData Data Feed
-
Enter the data feed url: http://{dc-host}/Citrix/Monitor/OData/v1/Data (or https: if you are using SSL) and click Next.
-
Select the tables you want to import into Excel and click Next.
-
Accept name defaults or customize names and click Finish.
-
Choose Connection Only or Pivot Report. The data is retrieved.
You can now use PowerPivot to view and analyze the data with PivotTables and PivotCharts. For more information, see the Learning Center: http://www.microsoft.com/en-us/bi/LearningCenter.aspx
Example 3 - LinqPad
-
Download and install the latest version of LinqPad from http://www.linqpad.net.
-
Run LinqPad with the appropriate administrative permissions for the XenApp or XenDesktop Site.
Tip:
the easiest way is to download, install and run on the Delivery Controller.
-
Click the Add connection link.
-
Choose WCF Data Services 5.1 (OData 3) and click Next.
-
Enter the data feed URL: http://{dc-host}/Citrix/Monitor/OData/v1/Data (or https: if you are using SSL). If necessary, enter the username and password to access the Delivery Controller. Click OK.
-
You can now run LINQ queries against the data feed and export the data as needed. For example, right-click Catalogs and choose Catalogs.Take(100). This returns the first 100 Catalogs in the database. Choose Export>Export to Excel with formatting.
Example 4 – Client Library
Currently Citrix Monitor Service supports OData protocol V1-V3. So when implement the OData consumers with various programming platforms, please select correct client libraries.
Example 4.1 – C#/.NET
Calling an OData Service From a .NET Client (C#)
Code Fragment:
    /* GET http://{dc-host}/Citrix/Monitor/Odata/v3/Data/Catalogs */
    private static string ListAllCatalgs(MonitorService.DatabaseContext context)
    {
        StringBuilder sb = new StringBuilder();
        Foreach (var c in context.Catalogs)
        {
            sb.Append(DisplayCatalog(c));
        }
        return sb.ToString();
    }
<!--NeedCopy-->
    /* GET http://Url/Machines()?$select=Name, IPAddress */
    private static void ListMachineNames(MonitorService.DatabaseContext context)
    {
        var machines = from m in context.Machines select new { Name = m.Name, IP = m.IPAddress };
        foreach (var m in machines)
        {
            if (m.Name != null && m.IP != null)
            {
                Console.WriteLine("{0} : {1}", m.Name, m.IP);
            }
        }
    }
<!--NeedCopy-->
    /* use the LINQ Skip and Take methods to skips the first 40 results and takes the next 10 */
    /* GET http://{dc-host}/Citrix/Monitor/Odata/v3/Machines()?$orderby=Id desc&$skip=40&$top=10 */
    private static void ListMachinesPaged(MonitorService.DatabaseContext context)
    {
        var machines =
            (from m in context.Machines
             orderby m.Id descending
             select m).Skip(40).Take(10);

        foreach (var m in machines)
        {
            Console.WriteLine("{0}, {1}", m.Name, m.IPAddress);
        }
    }

<!--NeedCopy-->
    /* GET http://Url/Catalogs()?$filter=Name eq '$Name'*/
    private static void ListCatalogByName(MonitorService.DatabaseContext context, string name)
    {
        var catalog = context.Catalogs.Where(c => c.Name == name).SingleOrDefault();
        if (catalog != null)
        {
            DisplayCatalog(catalog);
        }
    }
<!--NeedCopy-->
Example 4.2 – Java
Calling an OData Service from a Java Client based on Odata4j v0.3 library:
http://www.odata.org/libraries/
http://odata4j.org/v/0.3/javadoc/
Code Fragment:
// create consumer instance
String serviceUrl = "http://{dc-host}/Citrix/Monitor/Odata/v1/Data/";
ODataConsumer consumer = ODataConsumer.create(serviceUrl);
<!--NeedCopy-->
// ================General Query================================
Enumerable<String> qEntitySets = consumer.getEntitySets();
System.out.println(qEntitySets.first().toString());


Enumerable<OEntity> qList = consumer.getEntities(qEntitySets.first()).execute();
System.out.println(qList.first().toString());

OEntity qEntity = qList.first();
System.out.println(qEntity.getProperties().get(0));

OProperty<?> qProperty = qEntity.getProperties().get(0);
System.out.println(qProperty.getName());
System.out.println(qProperty.getType());
System.out.println(qProperty.getValue());
<!--NeedCopy-->
// =================Filter Query===========================================
/* GET http://{dc-host}/Citrix/Monitor/Odata/v1/Data/Machines */
String entitySetName = "Machines";
qList = consumer.getEntities(entitySetName).execute();
System.out.println(qList.first().toString());

/* GET http://{dc-host}/Citrix/Monitor/Odata/v1/Data/Machines()?$select=Name, IPAddress */
qList = consumer.getEntities(entitySetName).select("Name,IPAddress").execute();
System.out.println(qList.first().toString());

/* GET http://{dc-host}/Citrix/Monitor/Odata/v1/Machines()?$orderby=Id desc&$skip=40&$top=10 */
qList = consumer.getEntities(entitySetName).orderBy("Id desc").skip(2).top(10).execute();
System.out.println(qList.first().toString());

/* GET http://{dc-host}/Citrix/Monitor/Odata/v1/Machines()?$filter=Name eq '$Name'*/
qList = consumer.getEntities(entitySetName).filter("Name eq 'DOMAIN\\HOSTNAME'").execute();
System.out.println(qList.first().toString());
<!--NeedCopy-->