Getting Started
The keys to customizing the client UI are Cascading Style Sheets (CSS) and JavaScript. These are standard parts of the HTML specification familiar to web developers. To modify the CSS and JavaScript you need to use a text editor. You can use notepad but we recommend developer tools such as Visual Studio Code. These tools will warn you of any syntax errors and save you time in the long run.
Open the folder for your website, i.e. C:\inetpub\wwwroot\Citrix\[website name].
Custom content is stored in the \custom directory. This contains the following files that are loaded by the website:
-
style.css- Custom css styles. -
script.js- Custom scripts. -
strings.[language].js- Overrides for strings displayed on the UI.
You can also store other files within that directory. The content of the custom folder gets copied across all servers in a cluster and is preserved on StoreFront upgrades.
In addition there is a \customweb directory for storing dynamic content. By dynamic, we mean some content that is loaded and displayed every time, rather than being cached. Web browsers like to cache things when they can, but native clients always cache the UI, and always load the previously cached UI. You can store any content that needs to be loaded dynamically in the \customweb directory. Like the \custom directory, it gets copied across all servers in a cluster. However unlike the \custom directory it does not get downloaded and cached by the native clients.
Make the changes on your primary StoreFront server. Once you have completed them, within the Citrix StoreFront management console, navigate to the Server Group tab and click Propagate Changes. This will pause your server group and replicate the customizations to the other servers in the group (users will not be able to connect during propagation, so be sure to do this only during off-hours).
Styles
Let’s open style.css and make some simple changes. Add the following to the bottom of the file:
# CustomTop {
    height:30px;
    background:red;
}
<!--NeedCopy-->
This says “Find the area called customTop (strictly with id=customTop) and set its height to 30 pixels and its background color to red.”
Reload the website and you will find it has acquired a new region.
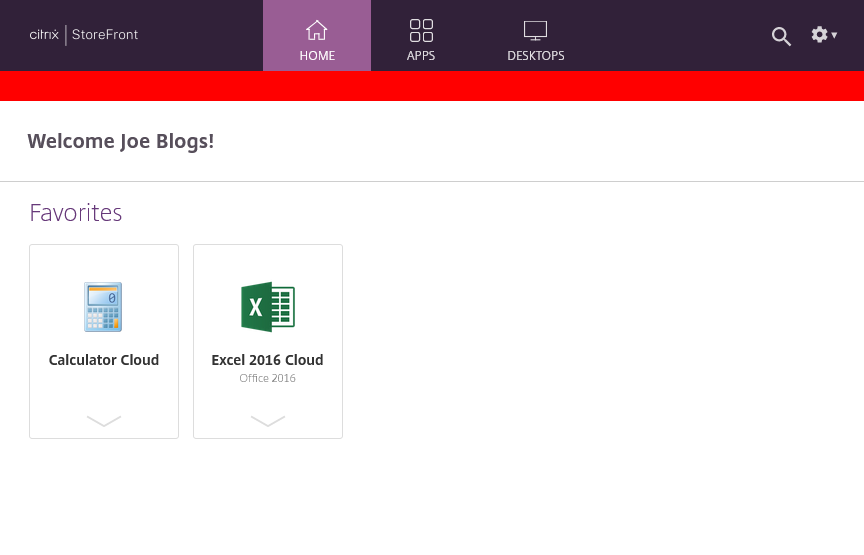
This region is exclusively for customization. A red stripe is fine. However, you can add more items like custom toolbars, messages etc. We will talk more about this in the next update. There are two other regions called # CustomScrollTop and # CustomBottom. Let’s define them all and take a look.
Add the following to the bottom of style.css. Save and reload the web page:
# CustomScrollTop{
    height:30px;
    background:blue;
}

# CustomBottom{
    height:30px;
    background:pink;
}
<!--NeedCopy-->
The blue strip (# CustomScrollTop) scrolls with the rest of the page, the other two are fixed. You can make these larger or smaller, or hide/show in different circumstances. As a simple example try adding the following lines:
.myhome-view # CustomTop {
    display:none;
}
<!--NeedCopy-->
Back to the web site and you will see that the blue region, is no longer shown on the ‘Favorites’ page. This new statement says “If the customTop element lives under an element marked with the myhome-view class, then hide it”. (myhome-view is the internal name for ‘favorites’).
.myhome-view is a marker classes. They are very powerful for showing/hiding or highlighting parts of the UI, whether custom regions or specific apps.
Here are some of the other marker classes:
| class | Description |
|---|---|
.large |
Indicates that the layout is optimized for a large display (e.g. desktop or tablet) |
.small |
Indicates that the layout is optimized for a Small display (e.g. a phone) |
.highdpi |
Indicates that high DPI images (x2) are being used |
.myhome-view |
The page is displaying the ‘Home’ view |
.desktops-view |
The page is displaying the ‘Desktops’ view |
.store-view |
The page is displaying the ‘Apps’ view |
Before we delve any deeper, let’s look at the tools the browser provides for inspecting and understanding the UI. In Chrome, hit F12 (or go to Menu->More Tools->Developer Tools).
This opens a complex developer UI. Much of this is beyond our needs, but here are some gems here worth learning. The most useful is the magnifying glass. Use this to select part of the UI and inspect it. Click on ‘Apps’ then the magnifying glass, then the Red Bar. You should see something like this:
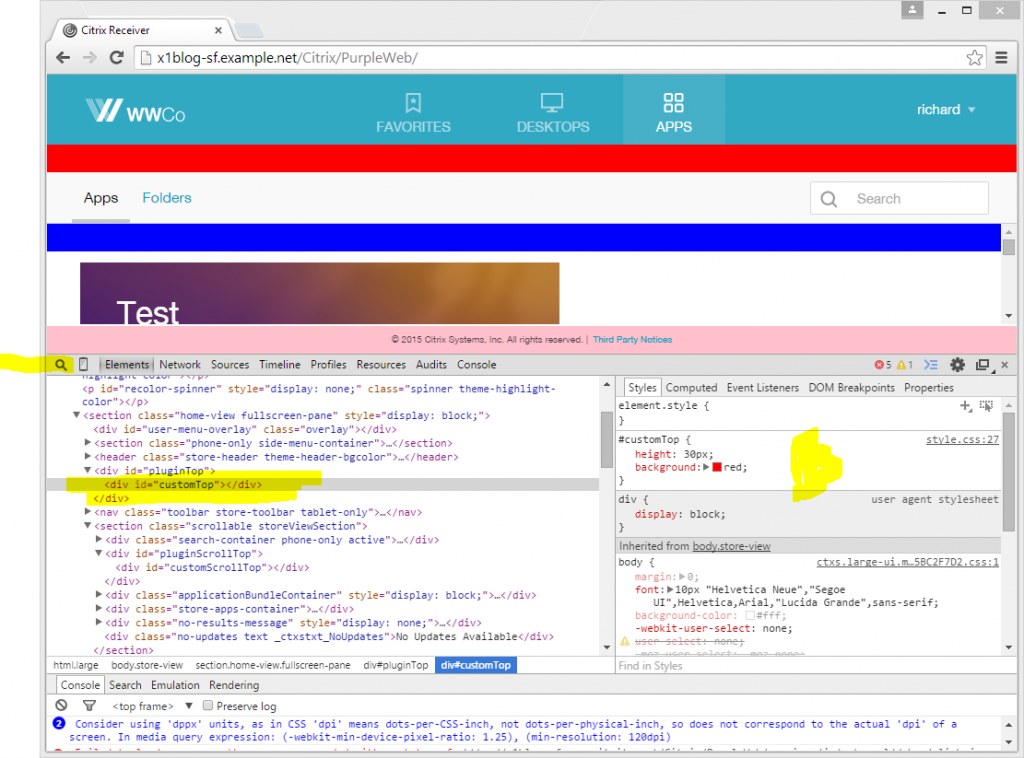
Note that this is showing the style information you just entered—height of 30 pixels and red background.
Click on Favorites and see what it says for this element. It is now showing an additional rule that hides the bar. Rules are cumulative – so the hidden bar is still red. You can see this if you were to change the second rule to something like height:15px (and remove the display:none part).
There is only so much you can do with style alone. Next we will add some scripting.
Scripts
Place any custom logic in script.js. As an example add the following:
CTXS.Extensions.postInitialize = function (callback) {
    alert("Hello World");
    callback();
};
<!--NeedCopy-->
This says that once initialization is complete, show an alert box (basic message box) and then call the callback function to continue processing.
postInitialize is one of a number of different hook functions that you can set to run logic at different stages. This hook function takes a “callback” argument, which you should call at the end of your function to continue processing.
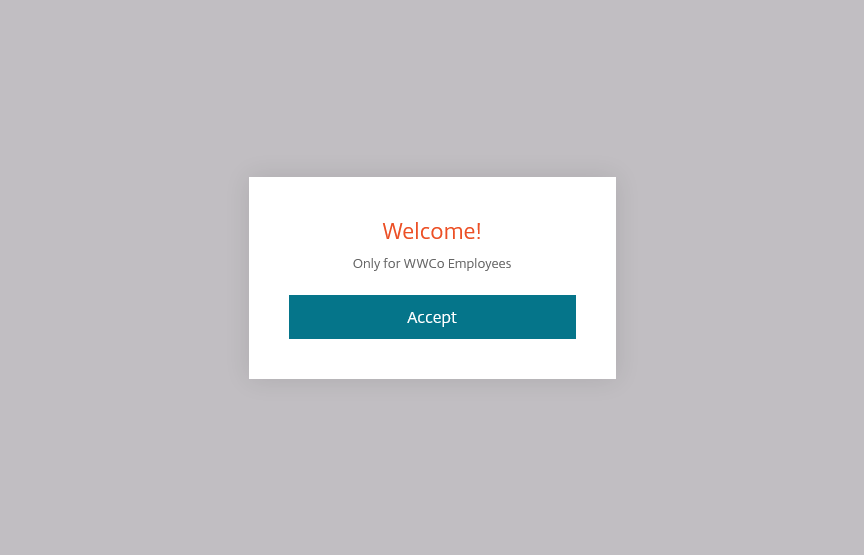
This can be improved to show a slightly nicer message box than JavaScript’s built-in alert by using another API CTXS.ExtensionAPI.showMessage.
CTXS.Extensions.postInitialize = function (callback) {
    CTXS.ExtensionAPI.showMessage({
        messageTitle: "Welcome!",
        messageText: "Only for WWCo Employees",
        okButtonText: "Accept",
        okAction: callback
 });
};
<!--NeedCopy-->
Debugging scripts
Always try a browser first as this is far easier than debugging customizations in a native client as you can use the built-in developer tools.
There are a number of suffixes you can add to to the URL to help with debugging.
| Suffix | Description |
|---|---|
-errors |
Display an alert box when an error occurs. Normally, the page will try to suppress any errors that might occur; this highlights any errors. |
-debug |
Disable any exception handling for customization code. This will make it easier to debug the exceptions using the browser developer tools. |
-nocustom |
Disable your script and CSS customizations. This is useful if the client isn’t working, and you want to find out if it is due to an error you have introduced. |
-tr |
Provides tracing of the UI code in a separate browser tab. This will include any tracing you add with calls to CTXS.ExtensionAPI.trace(). |
All these arguments can be used after the ? or # in the page URL, and you can string several together. For example http://storefront.wwco.net/Citrix/StoreWeb/#-tr-nocustom.
Changing Default Text
In the custom directory there are various files strings.[language].js, e.g. strings.en.js for English, that you can use to override the default text in that language.
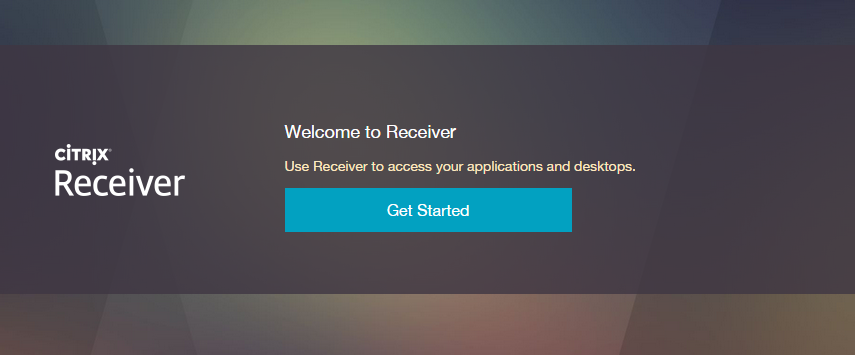
For example some people dislike the ‘Install’ screen used in Receiver for Web on Chrome. Instead you can soften this to ‘Get Started’ by adding a custom string:
(function ($) {
    $.localization.customStringBundle("en", {
        Install: "Get Started"
    });
})(jQuery);
<!--NeedCopy-->
Note
To find the name of the label to change, look in the directory
C:\inetpub\wwwroot\citrix\[website name]\receiver\js\localization\enand open the file calledctxs.strings_something.jsin notepad. Then look for the string you want to change. Note you shouldn’t edit this file directly, instead create override values in the custom directory as for the ‘install’ example.